Monitor and increase the productivity of the filling line
An incomplete or non-transparent data record is now a thing of the past thanks to Analytics. This service provides you with a live overview of the current status of your machine and also visualises the most important KPIs of your production process. Thus, you can find out exactly which areas have the untapped potential to continue increasing your line productivity.
At a glance:
- Performance Monitoring offers a live overview of line operation
- Reporting converts production data into clear, structured information
- Cause analysis helps you understand why losses occur
- Process validation documents and analyses critical quality-relevant processes
- Context Enhancement enables the production personnel to add missing context information to machine data
- Business Intelligence offers an overview in the form of standard management dashboards and configurable reports for multiple lines and locations
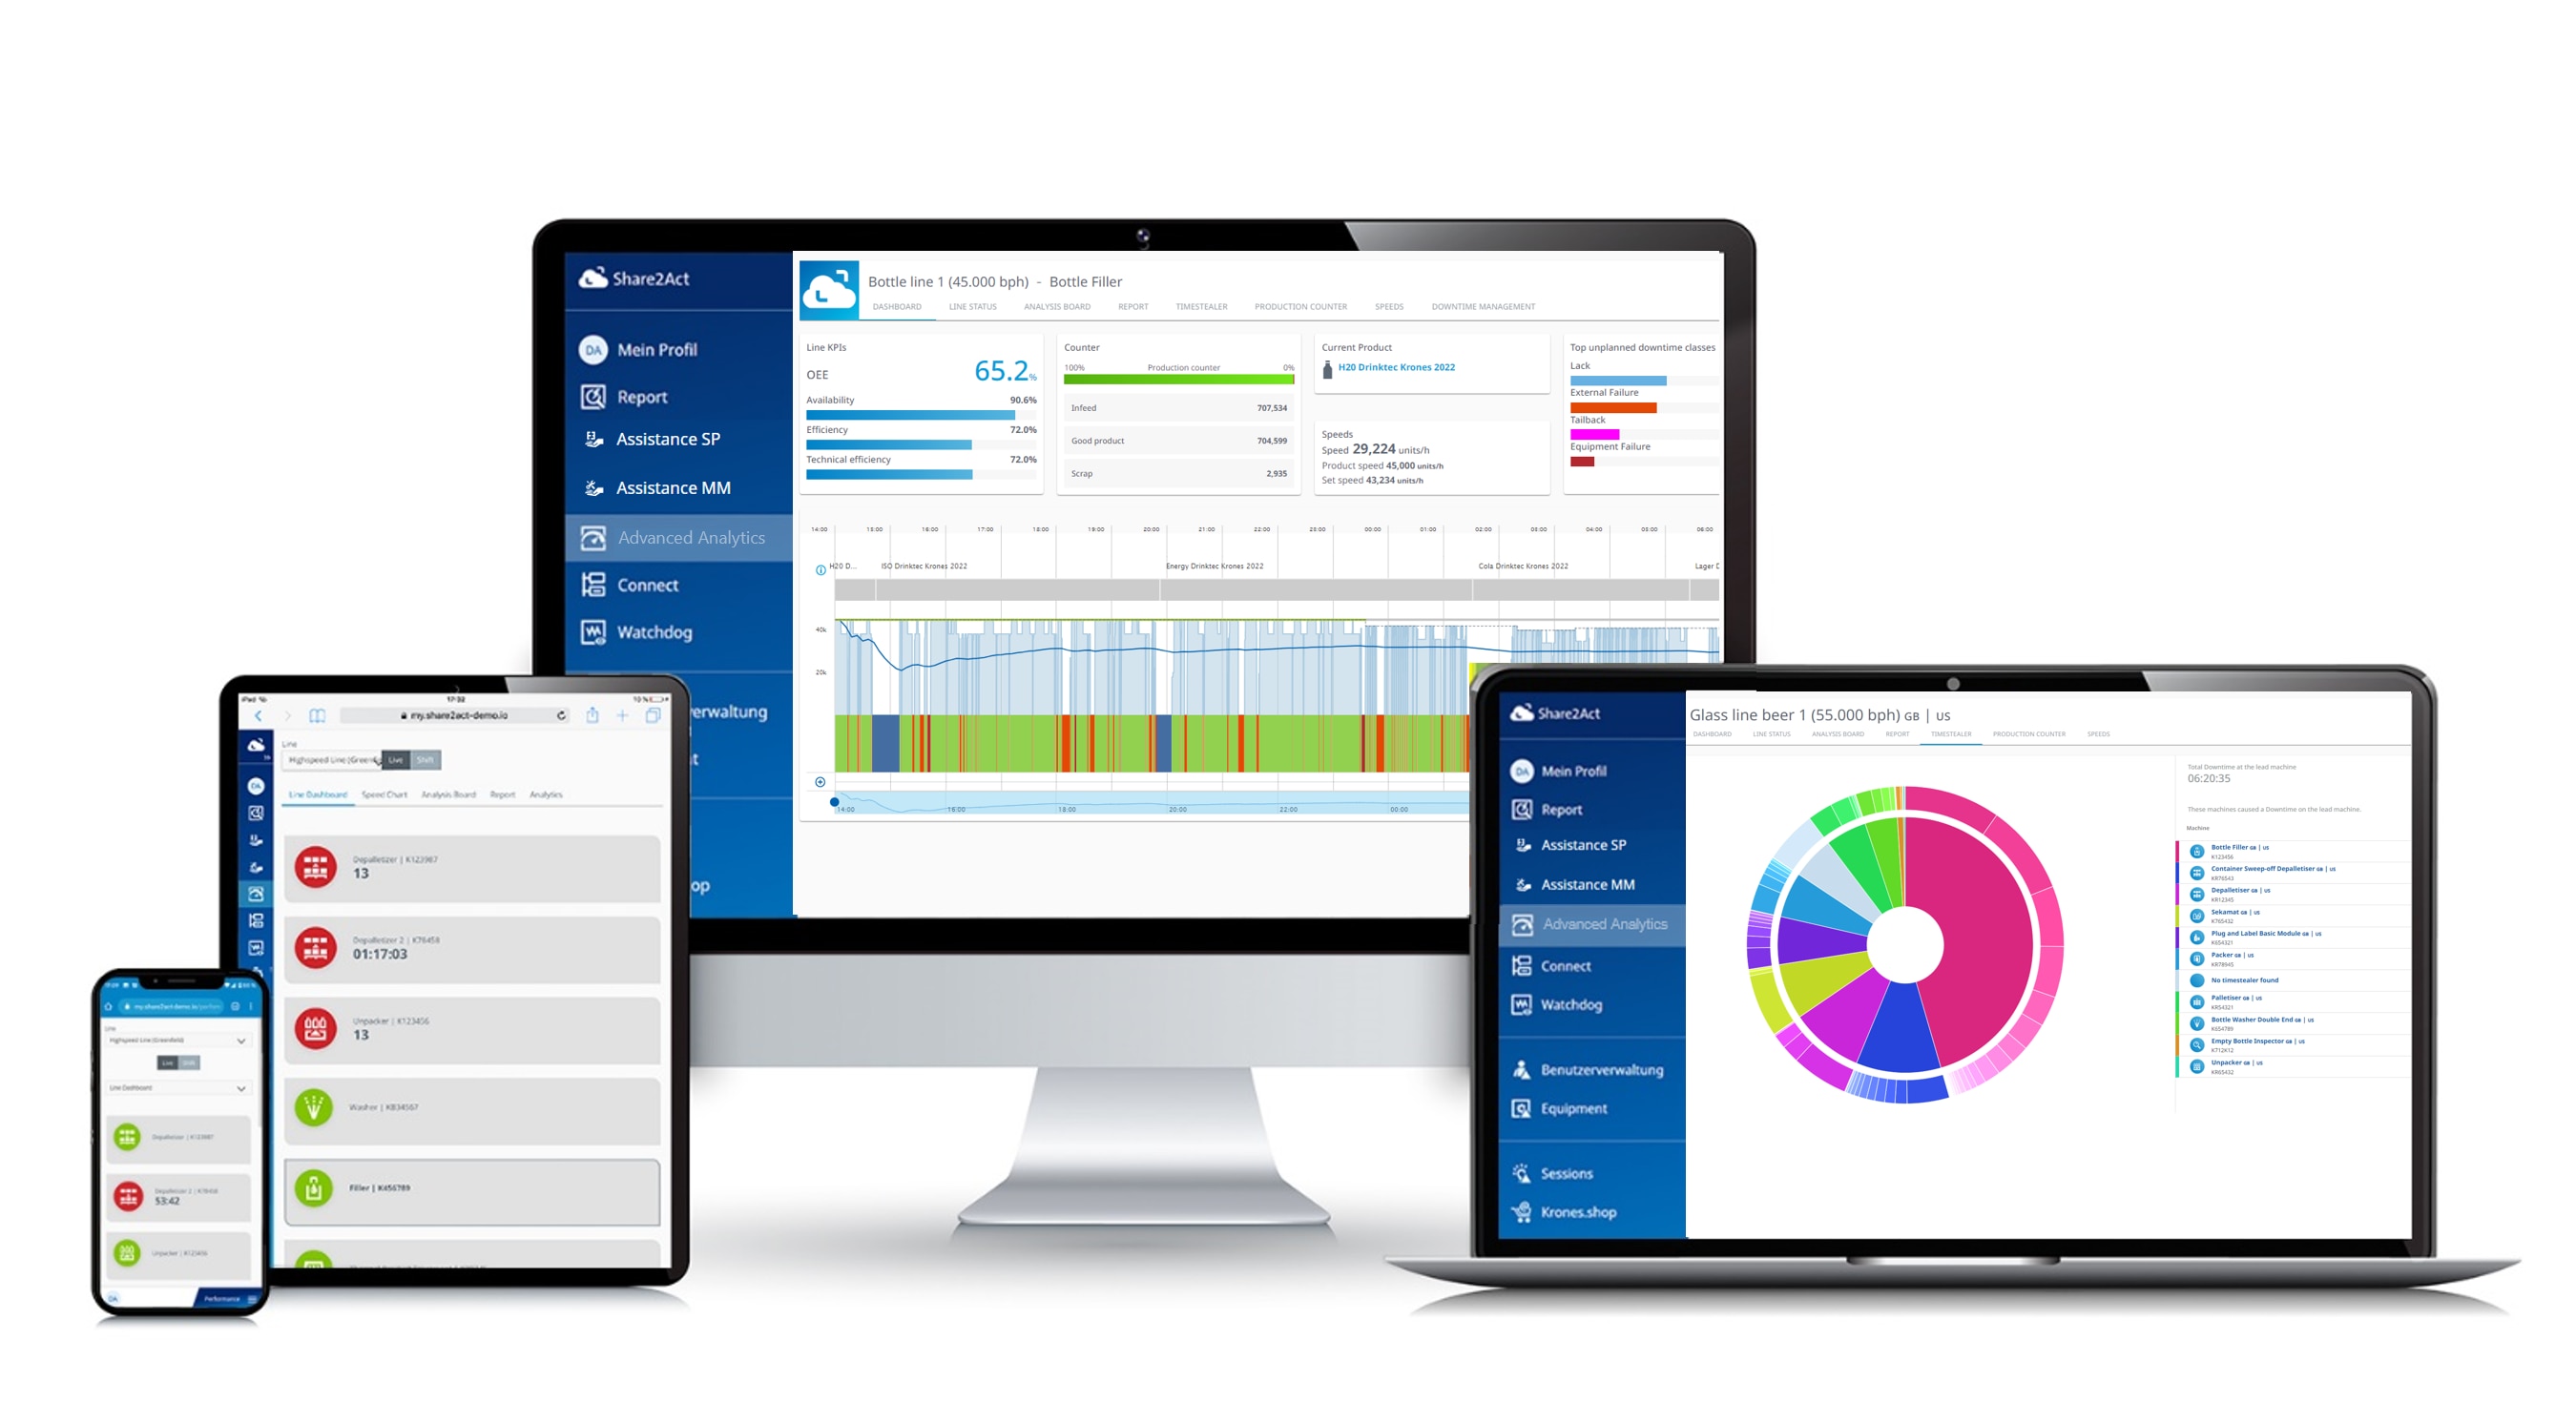

Scalable and flexible editions
Analytics follows an edition model that is designed for scalability and flexibility and thus meets the wide range of demands witnessed in the filling and packaging industry. Various editions and add-ons combine functionalities, which enable
- global players with multiple locations, wide product portfolios and different technologies to benefit from improved functions throughout the locations.
- manufacturers with only one product and one line to benefit from a lean, cost-efficient and simple set-up.
The editions allow for simple upgrading without changing the system and adjusting the scope of functions to suit their specific needs.
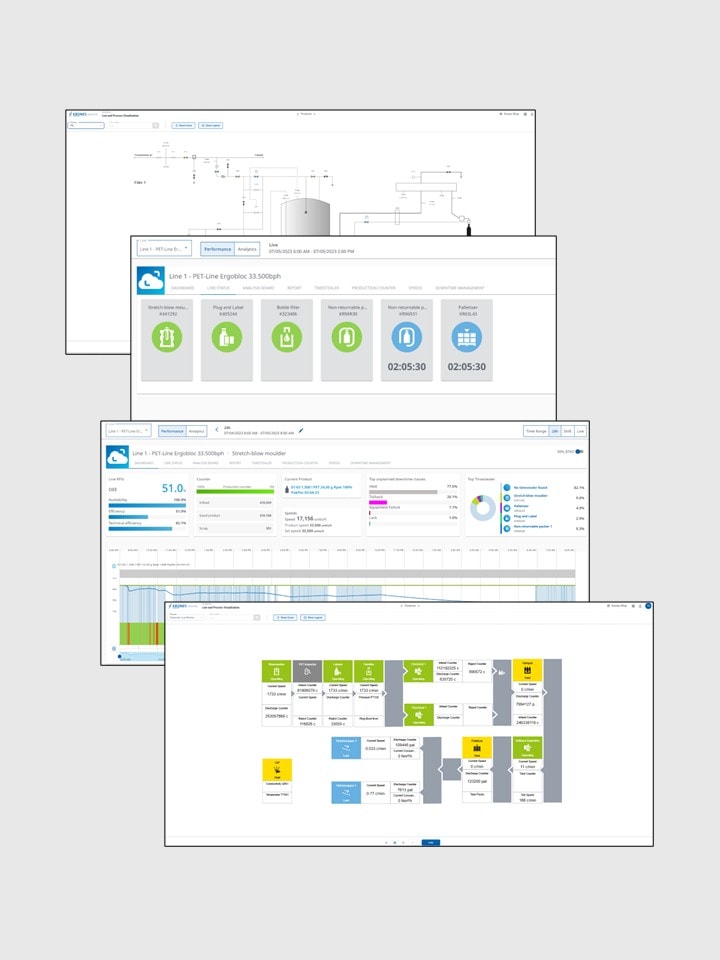
Performance Monitoring includes a number of visual tools that show how your line is operating during current production and in real time.
- The application provides a clear picture of the important KPIs, machine downtimes and production quantities that are represented intuitively and reflect the most important information about the production line.
- Both the operating and maintenance personnel, and the management see the same facts, thus making it easier to identify bottlenecks, detect malfunctions early and understand their impact on the complete line.
This provides transparency and supports the making of faster, well-founded decisions during everyday operation.
Performance Monitoring functions
- Automatic classification of downtimes
- Dashboard
- Line status
- Line and process visualisation system
Performance Monitoring includes a number of visual tools that show how your line is operating during current production and in real time.
- The application provides a clear picture of the important KPIs, machine downtimes and production quantities that are represented intuitively and reflect the most important information about the production line.
- Both the operating and maintenance personnel, and the management see the same facts, thus making it easier to identify bottlenecks, detect malfunctions early and understand their impact on the complete line.
This provides transparency and supports the making of faster, well-founded decisions during everyday operation.
Performance Monitoring functions
- Automatic classification of downtimes
- Dashboard
- Line status
- Line and process visualisation system
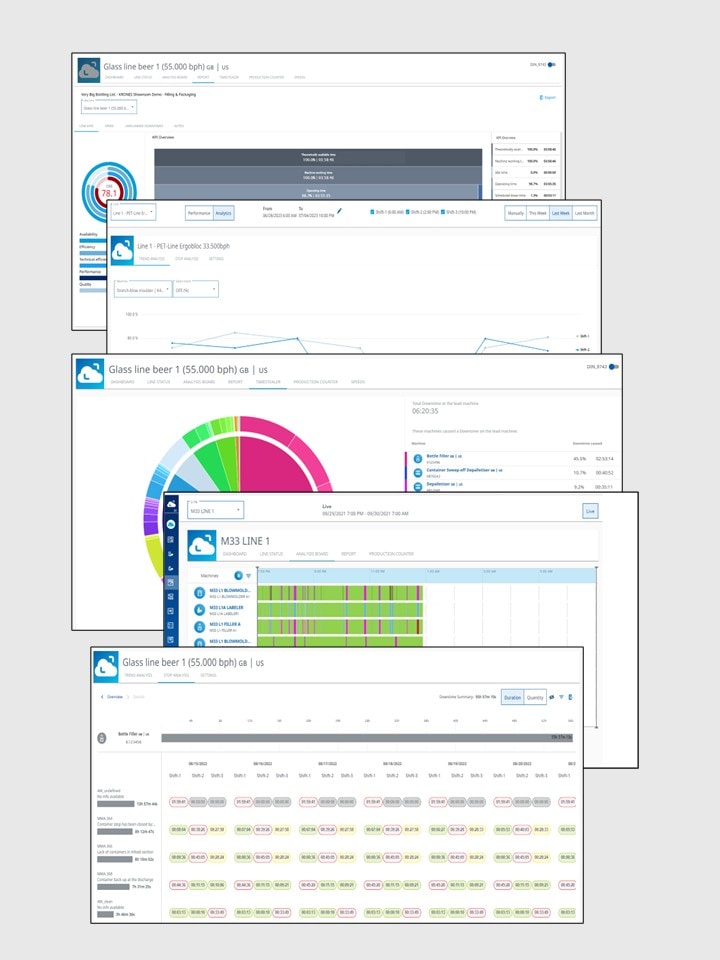
Reporting combines various views of your production data and thus provides a consistent, easily comprehensible picture of the performance of your lines.
- Standardised reports summarise the KPIs and events for a selected period of time.
- Detailed production counters provide an overview of good production and the scrap rate for each machine.
- Historical views are used to highlight long-term trends and recurring problems.
As a whole, these views reduce the manual data acquisition work, support shift and management meetings and allow decisions regarding improvement measures to be made based on facts rather than estimations.
Reporting functions
- Reports
- Production counter
- Historical analysis
Reporting combines various views of your production data and thus provides a consistent, easily comprehensible picture of the performance of your lines.
- Standardised reports summarise the KPIs and events for a selected period of time.
- Detailed production counters provide an overview of good production and the scrap rate for each machine.
- Historical views are used to highlight long-term trends and recurring problems.
As a whole, these views reduce the manual data acquisition work, support shift and management meetings and allow decisions regarding improvement measures to be made based on facts rather than estimations.
Reporting functions
- Reports
- Production counter
- Historical analysis
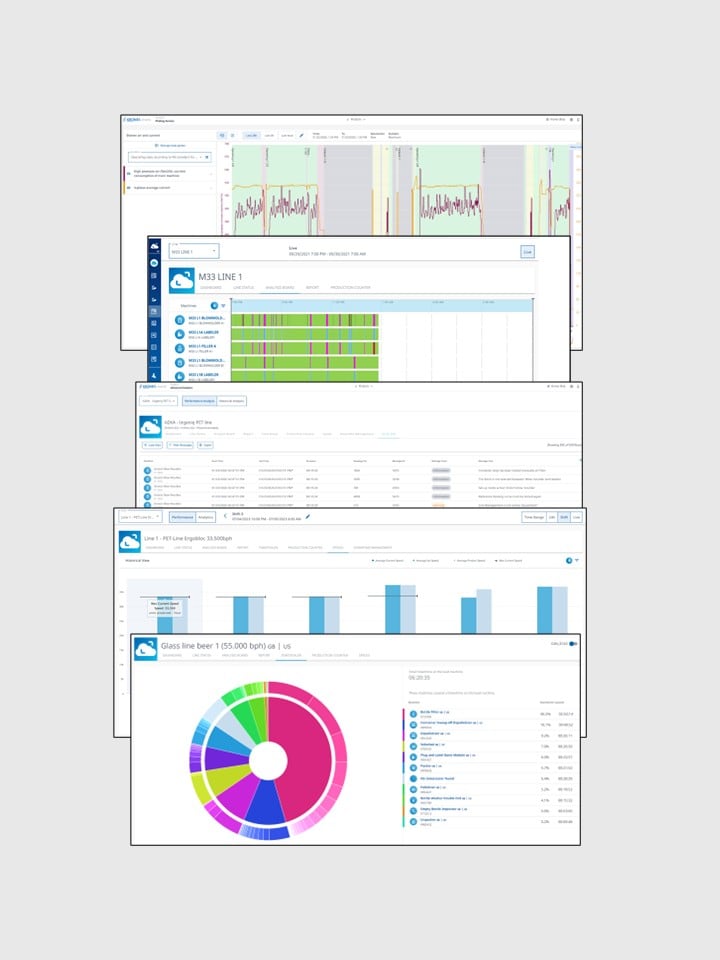
Cause Analysis involves multiple tools that help you to not only decipher ”What happened?” but also “Why did it happen?”.
- Status timelines show the behaviour of the machines before, during and after a downtime occurred.
- Detailed diagrams visualise how signals and parameters have changed.
- Message lists provide context information beyond mere downtimes.
- Special views highlight non-synchronised speeds and timestealer machines.
The combination of these views facilitates the analysis and identification of the actual causes and promotes better understanding of the interrelationships between machines and process conditions. Improvement measures can be derived in a targeted manner, thus making the trial and error method a thing of the past.
Cause Analysis functions
- Analysis board
- Diagrams
- Error list
- Speed
- Timestealer
Cause Analysis involves multiple tools that help you to not only decipher ”What happened?” but also “Why did it happen?”.
- Status timelines show the behaviour of the machines before, during and after a downtime occurred.
- Detailed diagrams visualise how signals and parameters have changed.
- Message lists provide context information beyond mere downtimes.
- Special views highlight non-synchronised speeds and timestealer machines.
The combination of these views facilitates the analysis and identification of the actual causes and promotes better understanding of the interrelationships between machines and process conditions. Improvement measures can be derived in a targeted manner, thus making the trial and error method a thing of the past.
Cause Analysis functions
- Analysis board
- Diagrams
- Error list
- Speed
- Timestealer
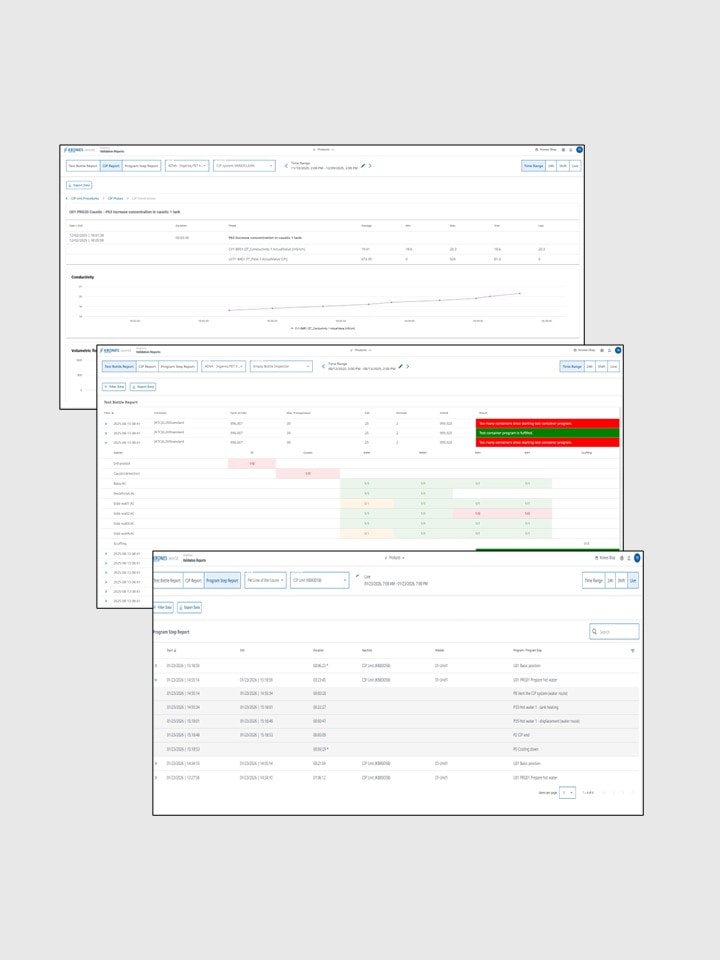
Process Validation focuses on the documentation and analysis of important quality-relevant processes, such as cleaning sequences, inspector tests and individual program steps.
- It provides special reports for CIP procedures, as well as for performing individual program steps and container test runs
- Raw data concerning the process can be converted into definite proof that can also be used as documents for audits.
Thus, it becomes clear if cleaning procedures and inspection systems function properly and always correspond to the defined standards. If deviations occur, their causes can be analysed more quickly, making it possible to meet internal and external quality requirements.
Process Validation functions
- CIP report
- Test container report
- Program step report
Process Validation focuses on the documentation and analysis of important quality-relevant processes, such as cleaning sequences, inspector tests and individual program steps.
- It provides special reports for CIP procedures, as well as for performing individual program steps and container test runs
- Raw data concerning the process can be converted into definite proof that can also be used as documents for audits.
Thus, it becomes clear if cleaning procedures and inspection systems function properly and always correspond to the defined standards. If deviations occur, their causes can be analysed more quickly, making it possible to meet internal and external quality requirements.
Process Validation functions
- CIP report
- Test container report
- Program step report
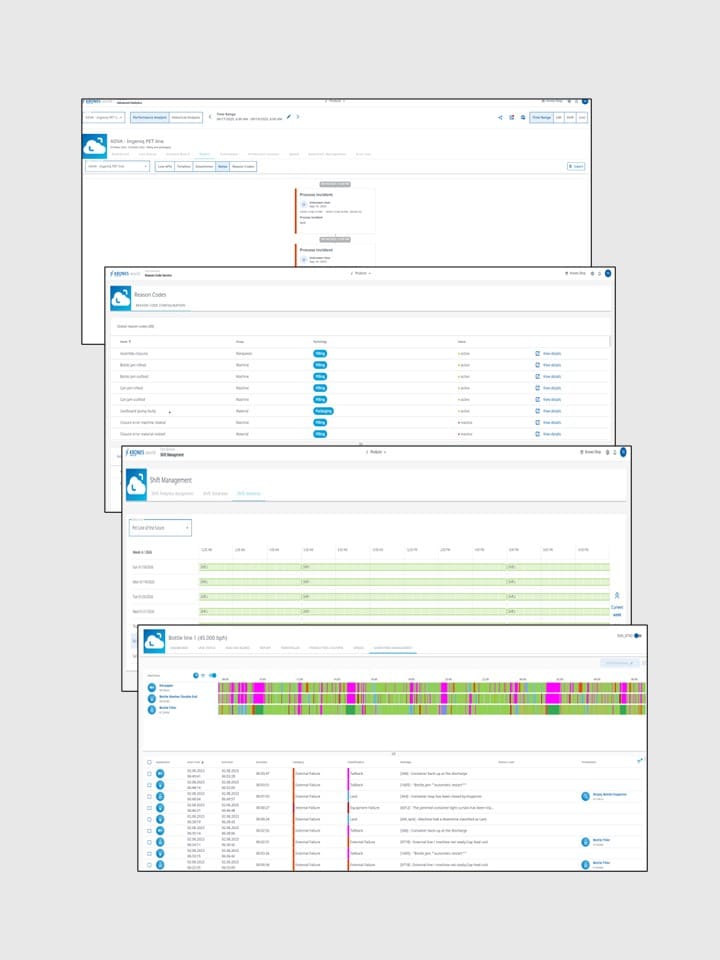
Context Enhancement contains information that cannot be derived solely from the machine data.
- Functions are combined that allow operators and management to input their knowledge directly to the system.
- Additional context is generated due to the reclassification of downtimes, the allocation of reason codes and the management of shifts.
This human input improves sustainability, reliability and validity of the recorded events and KPIs. Reports and analyses therefore reflect the actual production situation more precisely, improvements can be discussed based on high-quality, well-defined data.
Context Enhancement functions
- Downtime management
- Reason coding
- Shift management
- Routing
Context Enhancement contains information that cannot be derived solely from the machine data.
- Functions are combined that allow operators and management to input their knowledge directly to the system.
- Additional context is generated due to the reclassification of downtimes, the allocation of reason codes and the management of shifts.
This human input improves sustainability, reliability and validity of the recorded events and KPIs. Reports and analyses therefore reflect the actual production situation more precisely, improvements can be discussed based on high-quality, well-defined data.
Context Enhancement functions
- Downtime management
- Reason coding
- Shift management
- Routing
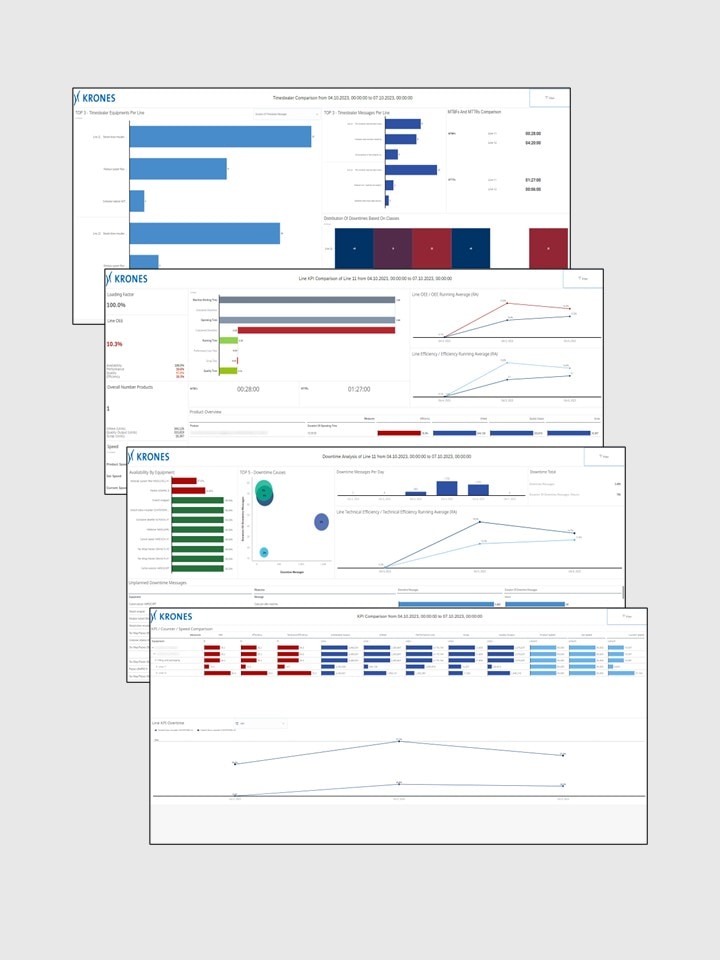
Business Intelligence expands the analysis of individual lines to include the entire production network.
- Historical data is aggregated and ready-made, adjustable reports are provided for comparisons across different lines and locations.
- This way, users can analyse unlimited report periods across lines, machines and locations.
Business Intelligence provides consistent KPIs and benchmarking views while allowing flexible, user-controlled analyses to be performed. This improves the performance management on company level, the transfer of best practices and strategic decisions based on a common, trustworthy data basis.
Business Intelligence functions
- Integrated Analytics
Business Intelligence expands the analysis of individual lines to include the entire production network.
- Historical data is aggregated and ready-made, adjustable reports are provided for comparisons across different lines and locations.
- This way, users can analyse unlimited report periods across lines, machines and locations.
Business Intelligence provides consistent KPIs and benchmarking views while allowing flexible, user-controlled analyses to be performed. This improves the performance management on company level, the transfer of best practices and strategic decisions based on a common, trustworthy data basis.
Business Intelligence functions
- Integrated Analytics
Providing support in all areas of production
Benefits
Cost-efficiency
Cost drivers for production downtimes are identified and continuously reduced.
Time savings
Optimise your time requirements thanks to the fast and comprehensive processing of all data.
Global availability
Use Analytics 24/7 – regardless of your location and selected end device.
Increase in the Overall Equipment Effectiveness
Obtain an overview of machine data and KPIs and thus create the foundations for increasing your Overall Equipment Effectiveness (OEE).
Transparency
Analytics records and logs all of the necessary status and process data of your production line.
Overview
The system translates a large amount of complex information about your line into informative key figures and thus makes it possible to develop sound actions.